Weather Underground API Interceptor
Hi! In this post I’ll show you how I convinced my humble SainLogic weather station to stop blurting its data to the public cloud and start reporting to a tiny Python service in my homelab instead. Along the way we’ll talk DNS hijacking (the friendly kind), Prometheus metrics, and a dash of Grafana eye-candy.
Preamble
For Christmas 2024 I unwrapped a shiny SainLogic Wi-Fi Weather Station. It’s a budget-friendly powerhouse that measures local weather data. Perfect for the nerd that wanted to be a tornado chaser when he was 10-years old.

This thing is fantastic—check out the sensor list:
- Temperature
- Humidity
- Pressure
- Wind Speed
- Wind Direction
- Daily Rain Total
- Rainfall Rate
- Solar Radiation & UV
- Other metrics derived from the above
Out-of-the-box the station’s console can either (a) show live values on a back-lit LCD, or (b) upload everything to Weather Underground or WeatherCloud once you jam your API key into its web UI. Nice—except giving third-party services carte blanche over my raw micro-climate data felt… well, wrong.
My “Old Man Yells at Cloud” Moment
Homelabbers live by one rule: my data, my drive bays. The idea of shipping gigabytes of precise location-based telemetry to somebody else’s analytics pipeline just so I can see yesterday’s dew point didn’t sit right. Surely I could keep everything on-prem and still get slick graphs?
How This Works
1. DNS Lookup
Whenever the console is turned on, and supposibly decides its DNS Cache is stale. It performs a DNS query for the endpoint below using whatever DNS server DHCP handed it:
rtupdate.wunderground.com
Remember that detail—we’ll exploit it shortly.
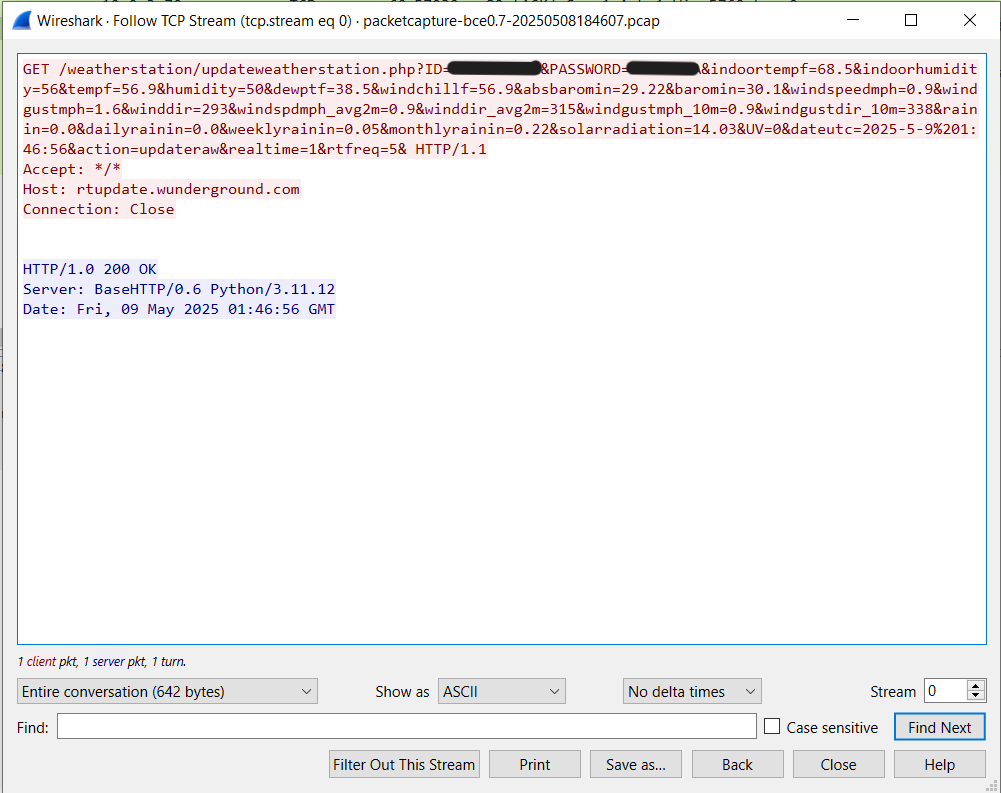
2. Clear-Text REST Call
After resolving the host, the console opens a TCP socket and fires a
GET /weatherstation/updateweatherstation.php
request containing every metric as URL parameters. Here’s a real
packet from my station (redacted only slightly):
/weatherstation/updateweatherstation.php?
ID=[REDACTED]&
PASSWORD=[NO API KEYS FOR YOU]&
indoortempf=64.8&
...
Yes, that’s plain old HTTP—no TLS, no obfuscation… nothing. Great news for hobby hackers; questionable security posture for a residential/commercial platform.
A Quick Rant
Dear IoT vendors: if your firmware can handle encrypted Wi-Fi stacks, it can handle TLS. It's a shame that we are still not encrypting data over the wire in 2025. And an open letter to Weather Underground, a 301/302 redirect to HTTPS would raise the bar overnight so IOT vendors can't get away this crap. It is your API keys that you are letting vendors abuse after all. End rant.
3. Putting It All Together
Because the console obeys our DNS, we can forge the
rtupdate.wunderground.com record so it points to a
little Python HTTP service in my LAN. The workflow:
- Python server listens on port 80.
- Non-matching paths → HTTP 404 (saves log spam).
- Matching paths → parse query string, cast values to floats,
and set the corresponding Prometheus
Gauge. - Expose
/metricsso Prometheus can scrape.
A sprinkle of generate_latest from
prometheus_client turns the server into a dual-purpose
collector + exporter.
class ExporterHandler(BaseHTTPRequestHandler):
    def do_GET(self):
        parsed = urlparse(self.path)
        if parsed.path == "/metrics":
            # Serve Prometheus metrics
            output = generate_latest(registry)
            self.send_response(200)
            self.send_header("Content-Type", CONTENT_TYPE_LATEST)
            self.end_headers()
            self.wfile.write(output)
        else:
            # Treat any other GET as a data push from the WeatherStation
            self.handle_update(parsed)

    def do_POST(self):
        # also accept POSTs (rare for this URI, but safe)
        parsed = urlparse(self.path)
        length = int(self.headers.get('Content-Length', 0))
        self.handle_update(parsed)

    def handle_update(self, parsed):
        if not parsed.path.endswith("/updateweatherstation.php"):
            self.send_response(404)
            self.end_headers()
            return

        query = parse_qs(parsed.query)
        # Update each gauge if present
        for key, gauge in gauges.items():
            if key in query:
                try:
                    # take the first value and convert to float
                    val = float(query[key][0])
                    gauge.set(val)
                except ValueError:
                    pass  # ignore non-numeric

        # respond so station thinks it succeeded
        self.send_response(200)
        self.end_headers()

    # silence default logging
    def log_message(self, fmt, *args):
        return
4. Overriding DNS
In pfSense I created an override so any host asking for
rtupdate.wunderground.com receives 10.0.3.70 —
the address of my Python box:
PS C:\Users\idavis> nslookup rtupdate.wunderground.com 10.0.3.1
Server:  router.isaacdavis.local
Address:  10.0.3.1

Name:    rtupdate.wunderground.com
Address: 10.0.3.70
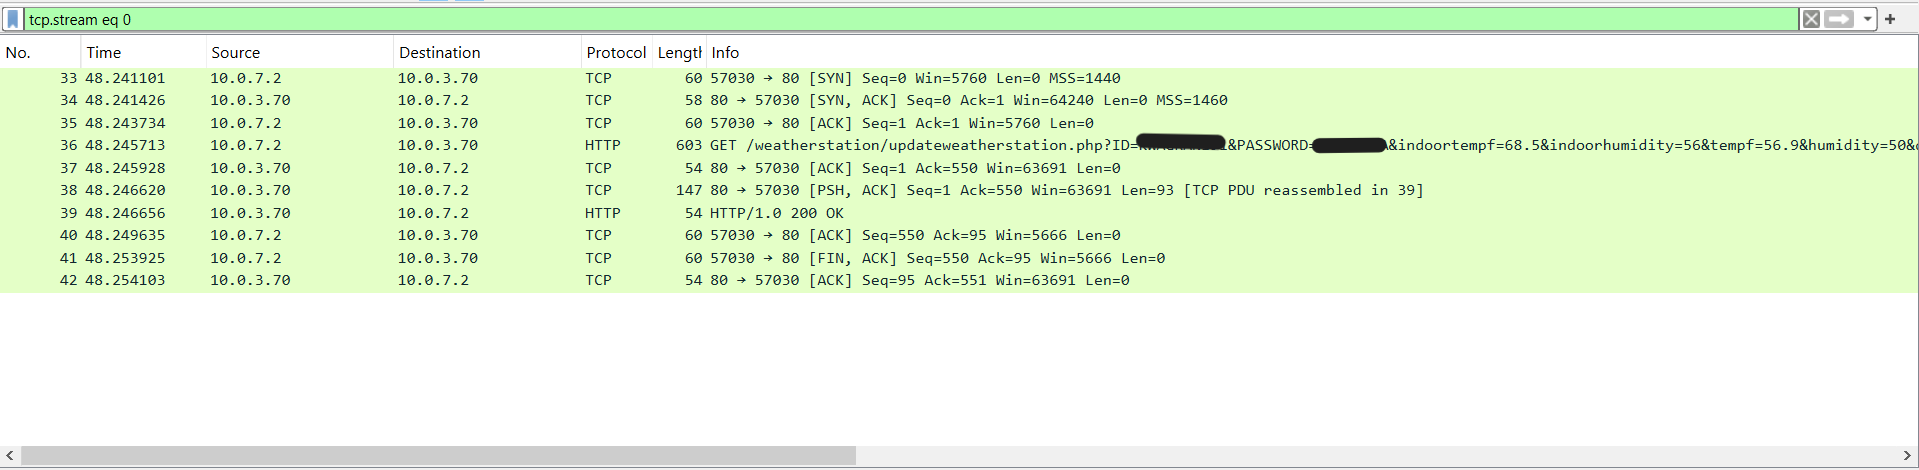
So … Does It Actually Work?
Absolutely. Here’s the proof of life from Wireshark (SYN, ACK, the whole dance) plus the HTTP 200 my service returns:
What Now?
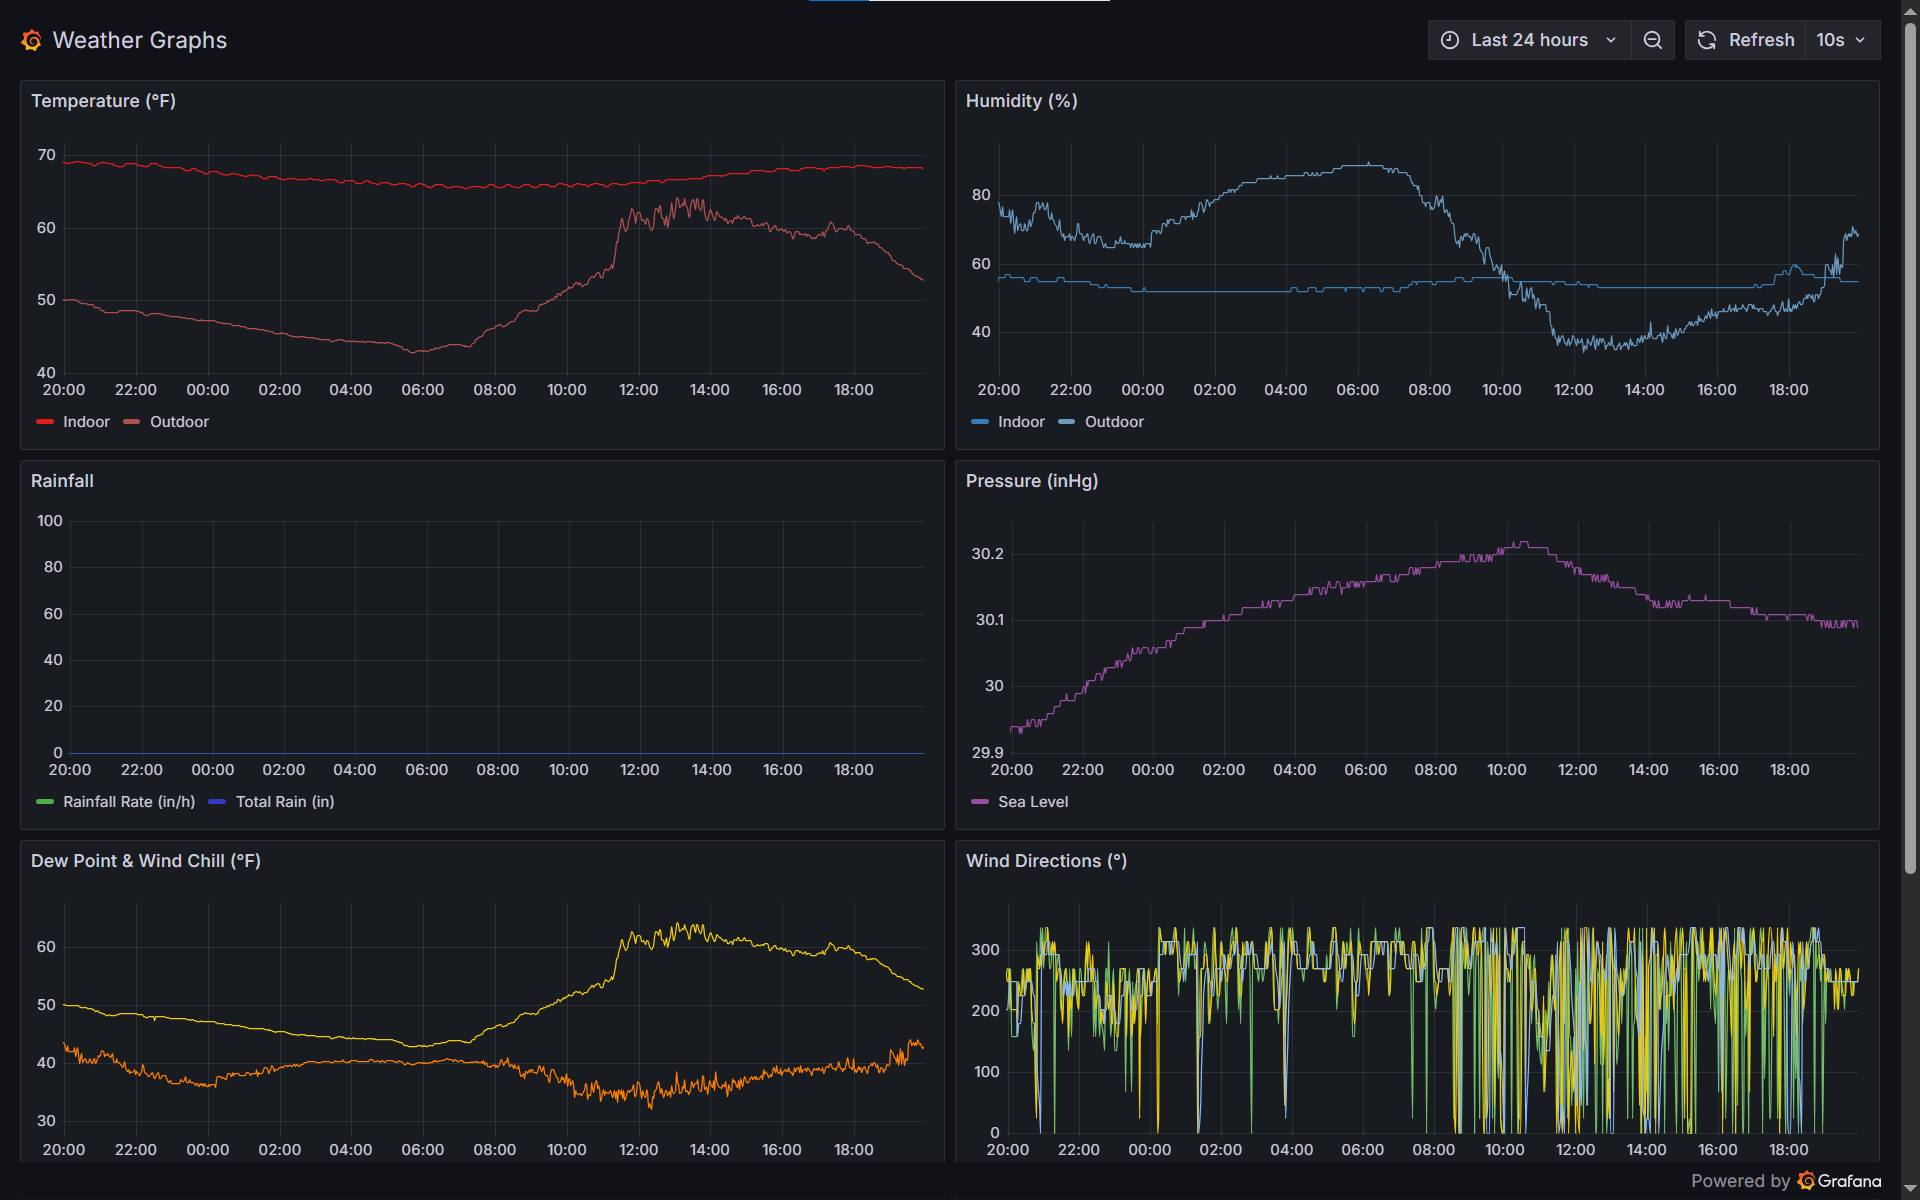
With every measurement stored as a time-series in Prometheus, the fun begins: alerting on high winds, long-term rainfall trends, “feels like” dashboards, you name it. Grafana hooks in via a simple scrape config, and voilà—candy-colored dials for every backyard statistic.
Grab the Code
Want to run this in your own homelab? Clone the fully documented project on GitHub: github.com/isaac-davis-15/Wunderground-API-Interceptor . The repo includes the lightweight Python server and a Dockerfile to build an easily deploy-able docker image to take control of your weather station.